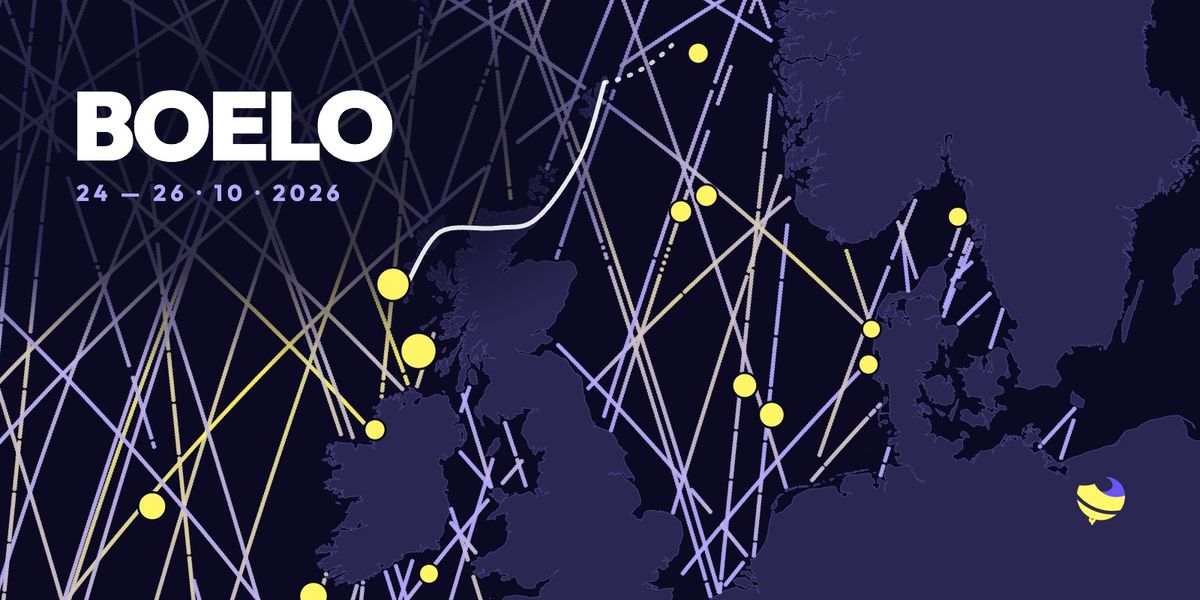
Storm Boelo from Ireland to Denmark: what buoys and satellites measured
A 15.9 m wave at the M3 buoy, 12.1 m significant wave height in the Hebrides, 12.9 m seen by Jason-3: Storm Boelo, 24–26 October 2026, from Ireland to Denmark, told by buoys and satellites.
On the evening of Saturday 24 October, Storm Austen had just left the North Sea. Boelo was already reaching Scotland. In less than 48 hours it crossed the west of Ireland, the Hebrides and the north of Scotland, then the North Sea all the way to Denmark, Norway and Sweden.
I went through every measurement available on The Buoy along its path: buoys, coastal weather stations, and the altimetry satellites that measure wave height from space. Buoys measure non-stop, but at fixed points, sometimes hundreds of kilometres apart. Satellites pass in between. Here is Boelo's story, in numbers.

Significant wave height is the average of the highest third of the waves. It is what buoys and satellites report and what The Buoy shows. Some buoys also record the highest single wave, roughly one and a half to two times higher.
Boelo's path, step by step
Sat 24, afternoon
The Atlantic: the swell reaches Ireland
- 15.5 mhighest wave at M6 →
- 12.9 mJason-3 off Donegal
- 11.4 mhighest wave at M5 →
On Saturday afternoon the swell comes in from the west. At 4:32pm, the Jason-3 satellite crosses the Atlantic north-west of Ireland and measures a significant wave height of 12.9 m off Donegal. It passes between the M6 buoy and the Hebrides buoys, more than 300 km from either: the highest satellite reading of the whole storm.
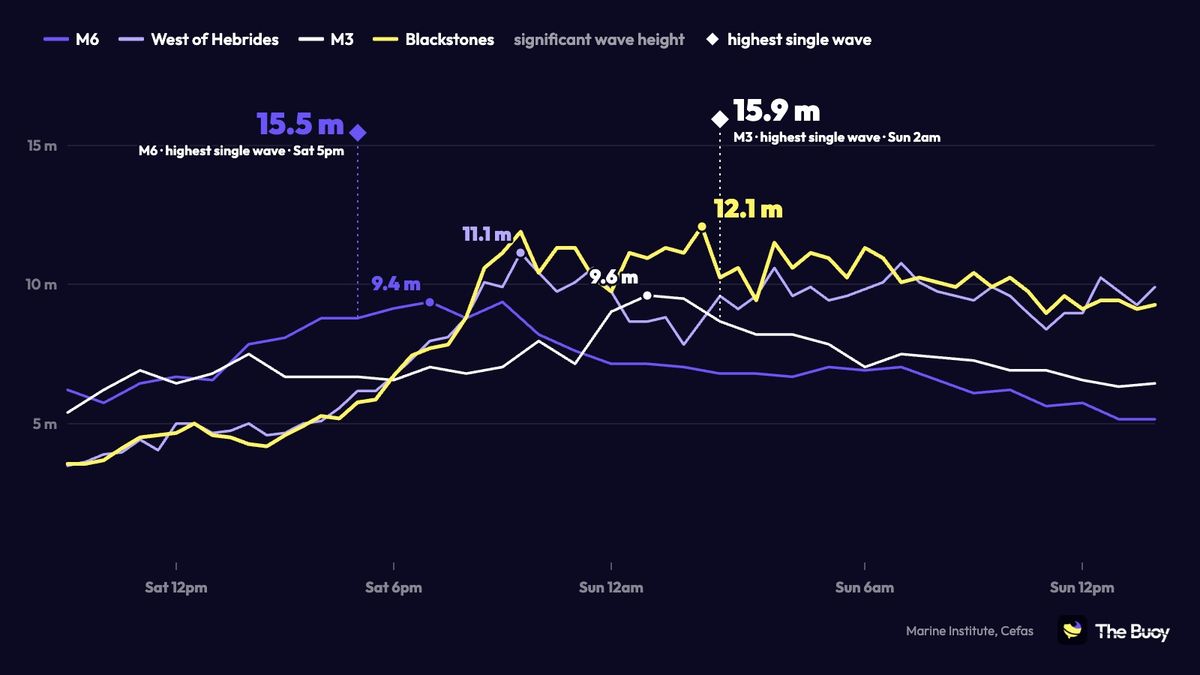
Meanwhile M6, moored nearly 400 km off the west coast of Ireland, records a 15.5 m wave around 5pm, then 9.4 m significant wave height at 7pm. South-east of Ireland, the M5 buoy records an 11.4 m wave.
Night of 24–25
Scotland under the low
- 948 hPaat Stornoway
- 136 km/hgusts at Machrihanish and Malin Head
- 11.1 mat West of Hebrides →
The low passes over the Outer Hebrides: 949.5 hPa at South Uist around 10pm, then 948 hPa at Stornoway at 11pm. Just ahead of it, the West of Hebrides buoy reaches 11.1 m at 9:30pm.
At 11:49pm a second satellite, Sentinel-6, measures 12.5 m 90 km west of Donegal. On the coast, gusts reach 136 km/h (85 mph) at Machrihanish, near the tip of Kintyre, and at Malin Head, the northern tip of Ireland.
Sun 25, 1–2am
The peak: 12.1 m in the Hebrides, a 15.9 m wave off Ireland
- 15.9 mhighest wave at M3 →
- 12.1 mat Blackstones →
- 9.6 mat M3 →
In the middle of the night, the Blackstones buoy off Islay peaks at 12.1 m significant wave height around 1:30am, the highest any buoy measured during Boelo. It had gone over 10 m at 8:30pm on Saturday and stays there, give or take a dip, until 10am.
Further south, 60 km off south-west Ireland, the M3 buoy reaches 9.6 m around 1am and records a 15.9 m wave at 2am: the highest wave measured in the whole storm.
Sun 25, daytime
The North Sea builds
- 13.4 mhighest wave at F3 →
- 8.7 mat F3 →
- 956 hPalow over Shetland
The low crosses the north of Scotland overnight, passes Wick around 1am and Shetland around 5am (956 hPa), then heads for Norway. Behind it, the north-westerly still gusts at 134 km/h at Stornoway around 11am and whips up the North Sea: an 11.4 m wave at the Gullfaks C platform, off Norway, as early as 3:40am.
In the afternoon the swell runs south. Off the Netherlands, the F3 platform measures 8.7 m at 4:50pm, then a 13.4 m wave at 6:40pm.
Sun 25, evening
Denmark, and a satellite between the buoys
- 9.6 mSentinel-6, mid-North Sea
- 11.2 mhighest wave at Fjaltring →
- 114 km/hgust at Thorsminde
In the evening the Danish west coast takes over. Gusts reach 111 km/h at Hanstholm around 7:10pm, then 114 km/h at Thorsminde at 8:50pm. The Nymindegab buoy peaks at 6.8 m at 10pm, and Fjaltring records an 11.2 m wave at 11pm, the highest on the Danish coast.
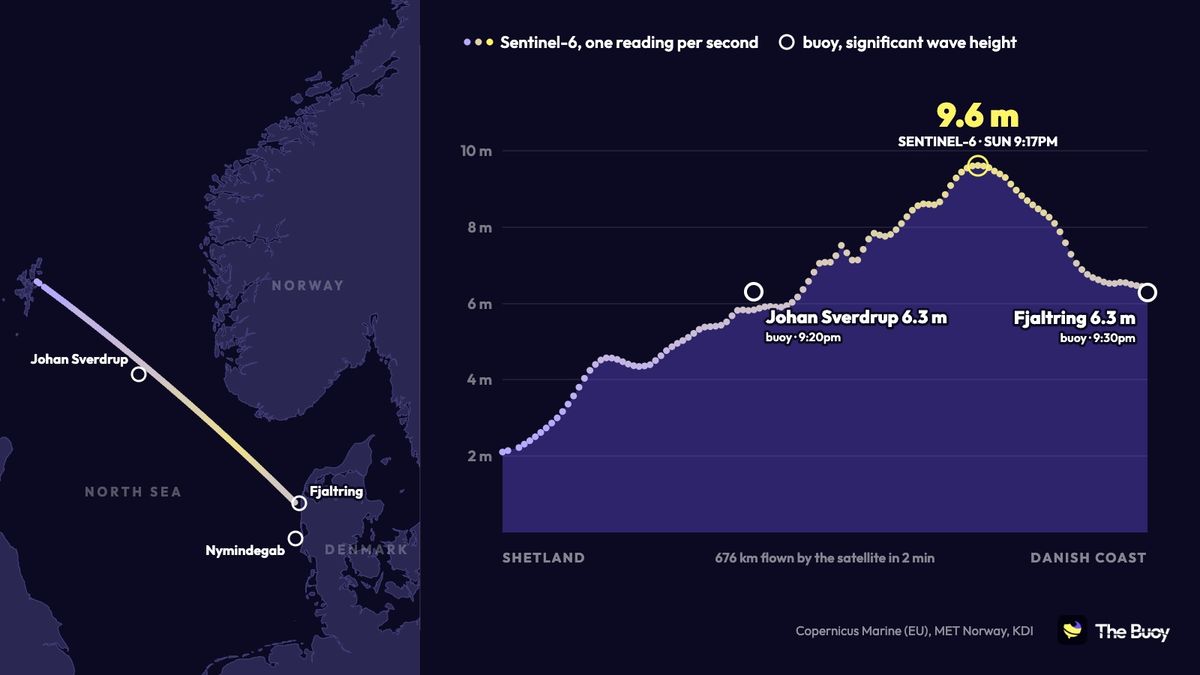
At 9:16pm, Sentinel-6 crosses the whole North Sea, from Shetland to the Danish coast: 676 km in two minutes, one reading per second. It passes 20 km from the Norwegian Johan Sverdrup platform and ends right next to Fjaltring. At both ends, satellite and buoys agree: about 6 m. But in between, over the 420 km that separate those buoys, the satellite sees the sea rise to 9.6 m. Neither buoy could measure that: this is exactly what satellites add.
Mon 26, morning
The Norwegian platforms, then the Skagerrak
- 11.9 mhighest wave at Johan Sverdrup →
- 8.6 mSARAL near Lindesnes
- 6.7 mat Väderöarna →
Overnight into Monday, the sea stays big on the Norwegian platforms. Gina Krog records an 11.8 m wave at 2:20am, and Johan Sverdrup peaks at 4am with 7.5 m and an 11.9 m wave.
At 4:34am the SARAL satellite measures 8.6 m about 20 km from Lindesnes, the southern tip of Norway. The sea then pushes into the Skagerrak: the Swedish Väderöarna buoy reaches 6.7 m with a 9.9 m wave at 6am. Then the sea calms down.
The highest waves, from Ireland to Sweden
Among all the buoys that record the highest single wave, Ireland comes first with M3 and M6, ahead of the Dutch F3 platform and the Norwegian platforms. In Denmark, Fjaltring reached 11.2 m.

Key numbers
- 15.9 m: the highest wave measured, at the M3 buoy off south-west Ireland, Sunday 2am.
- 12.9 m: the highest significant wave height seen by satellite (Jason-3, Saturday 4:32pm, off Donegal).
- 12.1 m: the highest significant wave height measured by a buoy (Blackstones, Hebrides).
- 136 km/h (85 mph): the strongest gusts, at Machrihanish and Malin Head.
- 948 hPa: the low at its deepest, at Stornoway.
- 9.6 m: the sea in the middle of the North Sea, between the buoys, seen by Sentinel-6.
- 11.2 m: the highest wave on the Danish coast, at Fjaltring.
Method and sources
All these measurements are on The Buoy: buoys from Ireland's Marine Institute, Cefas, MET Norway, Rijkswaterstaat, the Danish Kystdirektoratet and Sweden's SMHI; weather stations from the Met Office, Met Éireann, DMI and the Kystdirektoratet; and altimetry satellites through Copernicus Marine (European Union). Faulty readings were left out: the Bideford Bay, Perranporth and Cleveleys buoys in England, whose sensors failed, and any single wave more than 2.3 times the significant wave height at the time (for example 31.3 m at Nymindegab). Met Office gusts are the hourly maximum. UK times.
Buoys in this story
Download the app for more features
Access historical readings and compare readings with the forecast


No mandatory subscription or ads everywhere — a coffee helps keep servers running and the app improving.